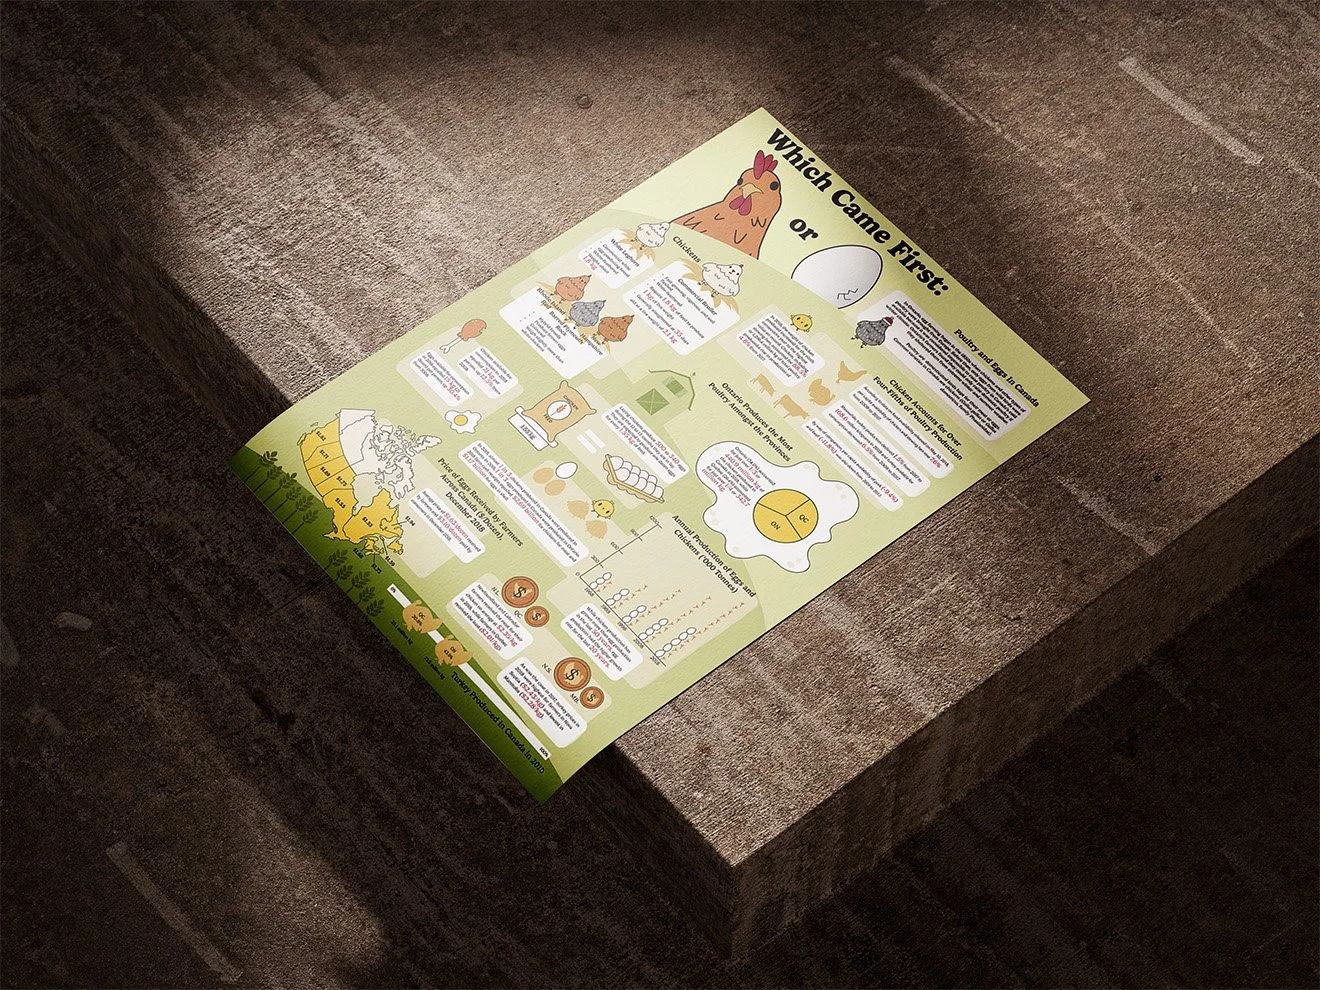
Which Came First:
A Visual Guide to Canadian Poultry Production
This infographic design project focused on presenting comprehensive data about poultry and egg production across Canada in an engaging, accessible format. The objective was to transform provided statistics on chicken breeds, provincial production rates, and industry trends into clear visual communication through custom illustrations and data visualizations, including pie charts, bar graphs, and maps highlighting regional differences. The final deliverable balanced educational content with visual appeal, making complex agricultural data easy to understand at a glance. The project was completed using Adobe Illustrator and Photoshop to ensure professional quality and presentation for both digital and print applications.